I’m sharing my research paper from a few years ago, which examines public sentiment on Twitter (now X) during the initial six months of the coronavirus pandemic. In this study, I analyze over 14,000 tweets using the R language. The research uncovers the evolving moods and key themes in global conversations as we faced an unprecedented health crisis.
Abstract
The World Health Organization declared the coronavirus outbreak a pandemic on March 11, 2020. However, preparations around the world to deal with this fast-emerging contagion had already started two months earlier when infections began to mount in Wuhan, China, the earliest epicenter of the coronavirus outbreak. Since then, people turned to social media platforms to share content related to the disease and its effects on their personal and professional lives. Twitter, in particular, has been a foremost choice for researchers when it comes to understanding public sentiments on trending topics and unfolding crisis situations. Using the R language and RStudio, this blogpost examines a corpus of randomized, COVID-19 related tweets from January to June 2020 with the goal of understanding people’s sentiments and overall discourse on the subject as the virus continued to infect people around the world. The findings reveal that people’s sentiments continued to dip (capturing increasing anxiety) during the initial phase of the outbreak, hitting its first lowest level at 0.09005964 (NRC lexicon) in early March before making a recovery, followed by another sharper dip. Moreover, word clouds, generated for each month (January to June 2020), expose prominent words from people’s conversations, adding meaningful context to understanding sentiment fluctuations.
1. Introduction
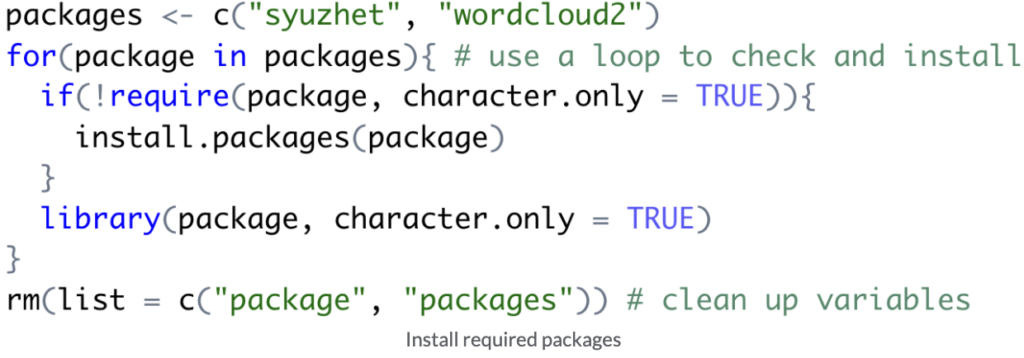
Social media platforms such as Twitter and Facebook have become de facto destinations for people of all backgrounds to engage in civic discourse with one another. Many people rely on them for breaking news, while government entities, corporations, and people of power use them to disseminate information and, in many instances, control the narrative. Given the enormous scale at which public conversations take place on these platforms, they have become particularly useful tools for conducting sentiment analysis around large-scale events affecting the masses. This paper, using a semantically annotated corpus of 14,056 tweets related to the COVID-19 pandemic, seeks to understand people’s sentiments during the initial six months of the coronavirus outbreak, dating from January to June 2020. Moreover, sentiment data points are paired with word clouds to find meaningful correlations and draw educated conclusions. All programming and analytical tasks are conducted in RStudio using the R language. The program uses the Wordcloud2 package to generate custom word clouds. It specifically makes substantial use of the syuzhet package for post-processing the data. The NRC Emotion Lexicon, part of the syuzhet package, is utilized to assign sentiments (positive or negative) to individual words and sentences.
This blogpost is organized as follows: Section 2 discusses the corpus of tweets. It specifically describes how the corpus was obtained and subsequently processed to a smaller subset in order to make the data handling feasible for this assignment. It also touches on the rationale behind limiting the dataset to the timespan of six months, from January to June 2020. Section 3 provides a theoretical primer on both sentiment analysis and word cloud techniques before delving into the coding-specific steps and highlighting some important decisions made along the way. Section 4 analyzes the findings with the aid of an NRC sentiment graph and several word clouds. For each month, three separate word clouds are generated, representing negative, neutral, and positive word clusters. Lastly, Section 5 summarizes the findings and offers conclusory thoughts on the project.
2. Corpus of Tweets
January to June 2020 offers a critical time period that encompasses the first known death from the coronavirus infection to the end of the initial wave in many parts of the world, including the United States. A corpus of 14,056 tweets—covering the aforementioned time frame—is derived from a larger, semantically annotated corpus of tweets about the COVID-19 pandemic. The process of compiling a smaller corpus for this assignment consists of a few steps. First, larger dataset parts 1 and 2 are downloaded from the distributor’s website and randomized for even distribution. Note that these data files only contain Tweet IDs since it is against Twitter’s content redistribution policy to publicly share the actual content of tweets. A ‘hydration’ process is necessary to fetch the actual tweet content. This process essentially fetches tweet content from Twitter’s server via a Twitter API. There are a handful of out-of-the-box software applications to accomplish this task. For this assignment, a software application called Hydrator is used to fetch tweet data. Once complete, a smaller number of records are copied into a new text file to form the final corpus for this assignment. In total, six text files make up the final corpus, each containing tweet content for that month.
3. Method
3.1 Sentiment Analysis and Segmented Word Clouds
Sentiment analysis, in the context of data science, is a programmatic approach to interpreting a text’s emotional intent. A handful of dictionaries exists to process text for its emotional intent. For this assignment, the NRC Emotion Lexicon is used, and it can be readily accessed via the syuzhet package. The NRC dictionary comes with eight basic emotions (anger, fear, anticipation, trust, surprise, sadness, joy, and disgust) and two sentiments (negative and positive). It is the sentiment part (negative and positive) that is utilized in this experiment. Sentiment analysis alone can offer interesting bits of insight into a text’s emotional arc. However, when this technique is utilized in conjunction with word clouds, a whole new set of meaningful, contextual data points emerge, revealing to researchers the words behind the emotion. And segmenting word clouds into positive (+1), neutral (no value, or 0), and negative (-1) word clusters offers even more nuanced understanding into the emotional drivers of the text. This assignment precisely combines both sentiment analysis and segmented word cloud techniques to make meaningful observations about people’s emotional state during the initial, six-month period of the coronavirus outbreak. In order to glean consistent and meaningful results, however, it is imperative that the text, which is to be analyzed, is written in a singular language, English, in this specific example, since the NRC Lexicon only supports English.
3.2 About the Source Code
This blogpost contains a minimal number of code snippets to highlight important coding techniques. The complete source code is available here for download.
3.3 Coding Technique: Graph Smoothing
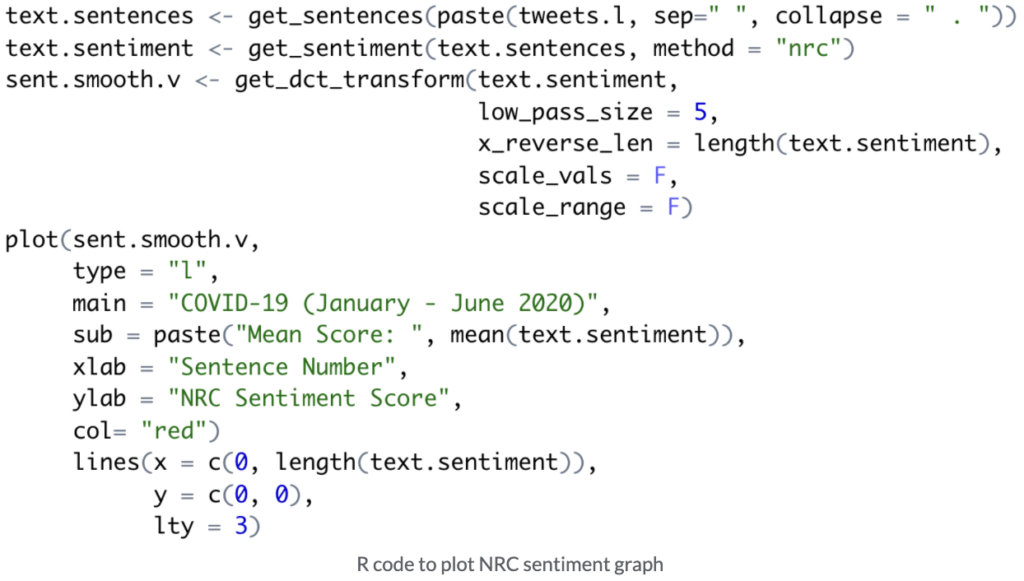
The syuzhet package comes with several powerful functions as well as the NRC Lexicon to speed up the analysis process. One such function is ‘get_dct_transform,’ which applies a set of filters to render a smoothed graph. One of the parameters responsible for the graph’s smoothing is the ‘low_pass_size’ parameter (see the code snippet below). The value of 5 usually yields a well-balanced, smooth graph, as is the case in this example. However, there may be times when less smoothing is desired in order to preserve more nuanced oscillations of the graph. In such instances, increasing the low_pass_size value to higher than 5 is required to achieve the result. The higher the number, the more refined the graph oscillations and less information lost to smoothing. Here’s the code snippet to plot the NRC sentiment graph.
3.4 Coding Technique: Removing Special Characters from Tweets
Tweets fetched via the Twitter API tend to contain quite a lot of special and usually unnecessary characters. See a screenshot below.

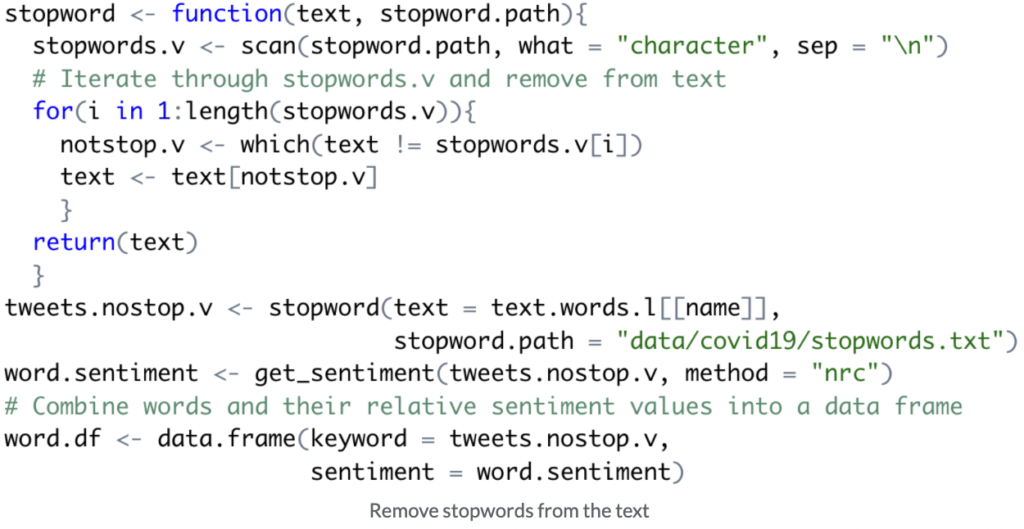
These characters are particularly problematic when generating word clouds. One way to rectify such an issue is by cleaning up the source file (containing tweets). However, it can be time-consuming, especially if tweet files have to be processed on a routine basis. In such a situation, a better solution is to add all special characters to the stopwords.txt file, which is traditionally used to remove stop words for more meaningful output. Doing so will yield cleaner word clouds without spending a considerable amount of time cleaning up tweet files.
3.5 Coding Technique: Producing Segmented Word Clouds
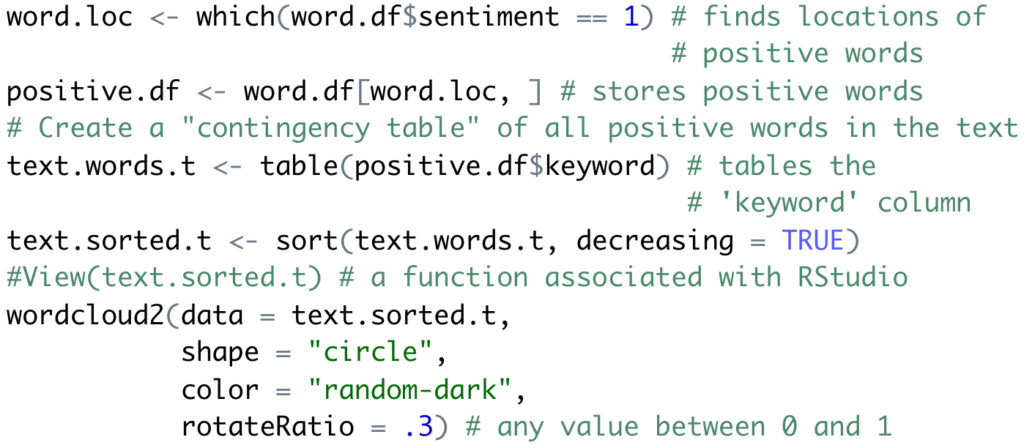
Instead of creating a single word cloud for each month, breaking them into positive (+1), neutral (no value, or 0), and negative (-1) word clusters offers a nuanced and meaningful understanding of people’s sentiments.
4. Findings and Discussions
The line chart below captures the sentiments of Twitter users during the first six months of the coronavirus pandemic. The mean sentiment score of 0.100133328775085 suggests a good balance between negative and positive sentiments. The NRC Lexicon operates with a fairly simple, three-value system to assign words with positive, negative, or neutral sentiment: -1 represents negative sentiment, +1 represents positive sentiment, and any word that does not fall into either category is considered neutral, or with zero value, having virtually no impact on the sentiment calculations.
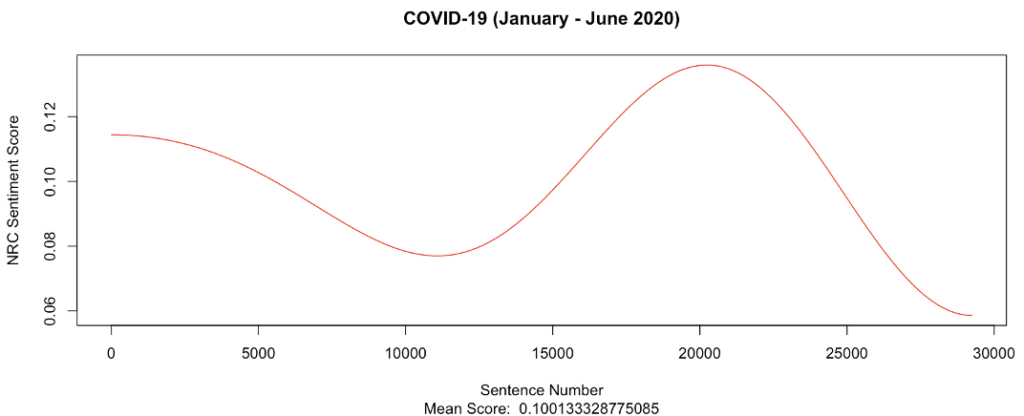
Besides representing the sentence numbers, the X-axis can also be thought of as the passage of time, from January to June 2020. Examining the graph more closely, public sentiments continue to dip, hitting their first lowest level in early March. This is perhaps indicative of people’s increasing anxiety as the coronavirus begins to spread to more parts of the world. Next, we examine word clouds for each month to develop an understanding of what may be influencing people’s sentiments. Tweets are divided into three clusters: negative, neutral, and positive.
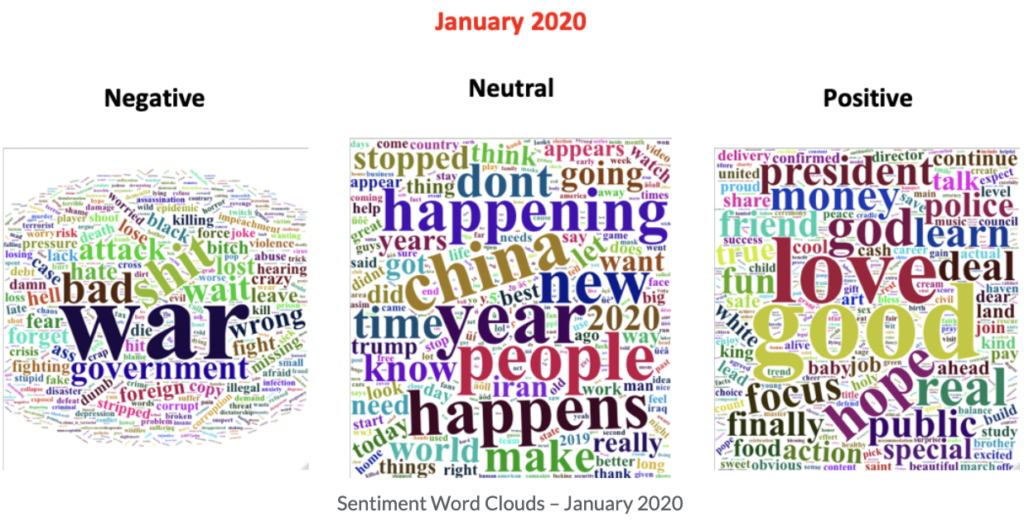
The sentiment graph indicates that public sentiments continue to move downwards as the month progresses. However, examining the word clouds, the downward trend doesn’t seem to be driven by chatter related to the coronavirus. In some ways, January represents the calm before the storm. Lack of any virus-related chatter suggests that people are largely unaware of the coronavirus. The neutral word cloud certainly contains the keyword “China,” however, after inspecting the tweets, it appears that it is used in a manner unrelated to the coronavirus outbreak. Overall, the data suggest that people are largely unaware of the coronavirus situation unfolding in China.

The sentiment graph suggests a continued downward slide of public sentiments throughout the month of February. The mean sentiment score of 0.09565711 represents a slight decline compared to the previous month. The noticeable presence of the word “virus” in the negative word cloud suggests a shift in conversations. The coronavirus seems to be the dominant theme in much of the conversations taking place on Twitter. Below is a representative tweet from the month of January, displaying people’s concerns related to the coronavirus.

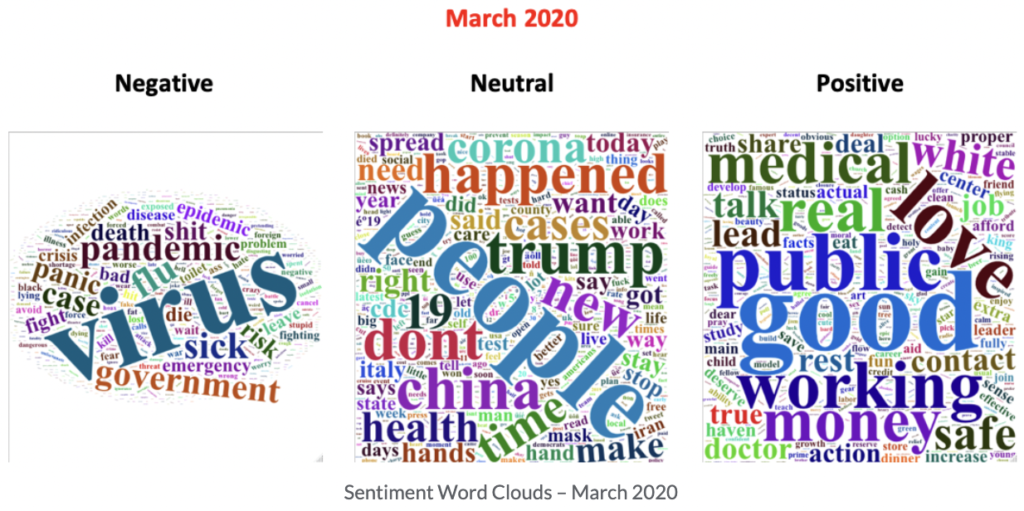
The sentiment level reaches its first lowest point since the start of the coronavirus outbreak. The word “virus” remains prominent in people’s discourse. Moreover, the appearance of the words “pandemic” and “19” in the neutral word cloud indicates that this outbreak, now termed COVID-19, has been declared a pandemic by the World Health Organization.
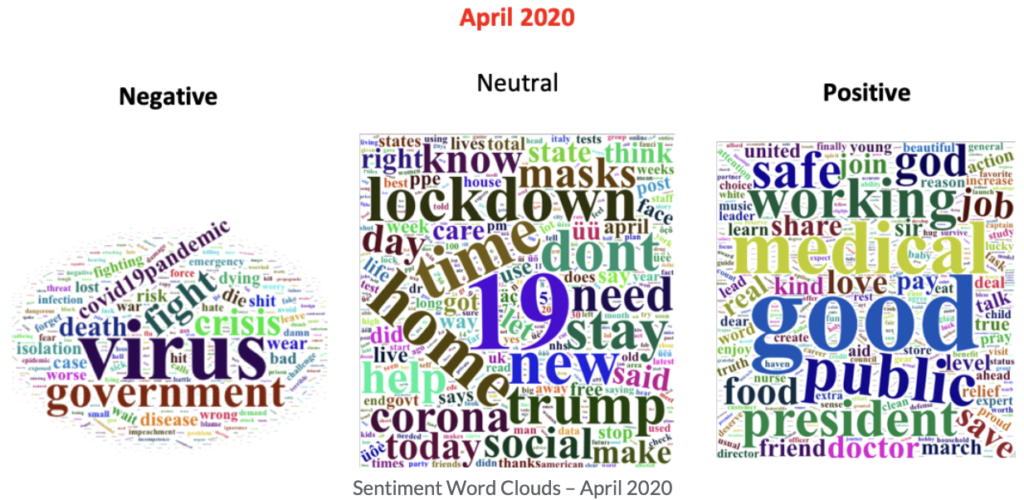
April marks the first month where public sentiments climb to their highest level since the start of the coronavirus outbreak. Examining the positive word cloud, words such as “medical” and “good” are among the most prominent words used in public conversations. Examining closely, we find the tweets related to “medical” largely seem positive as they refer to medical personnel, medical supplies, etc. The word “lockdown” makes a prominent entry into public conversations, as governments in the United States and around the world begin to ponder the possibilities of stricter rules around people’s movements to slow the virus transmission. However, belonging to the neutral category, it does not factor into the sentiment calculation. Additionally, “masks,” for the first time, surface as one of the top terms being discussed on Twitter.

May sees the sharpest decline in people’s sentiments after climbing to its highest level in the previous month. However, looking at the word clouds, such a rapid decline seems peculiar just on the basis of the COVID-19 pandemic. In examining the negative and positive word clouds, we begin to identify the pattern of racial unrest, likely emanating from the death of George Floyd. Another point of interest is the word “police” belonging to the positive word cloud. It makes sense. However, given the unique circumstances surrounding the George Floyd case, it is likely that “police” is spoken in a negative or neutral tone in most conversations. However, it did not make any difference in altering the downward path of the public sentiment graph. Additionally, the word “wear” belongs to the negative word cloud. Examining the actual tweets, “wear” is often part of a longer sentence, “wear a mask,” an act considered by most to be positive in the time of a pandemic. Inconsistencies like this are inevitable; however, they tend to wash out in the grand scheme of things.

Public sentiments continue to trend downward in the month of June, with the mean sentiment dipping to 0.08309673, the lowest among all six months. The growing prominence of the word “black” (evidently assigned to the negative sentiment; perhaps a system limitation?) indicates the dominance of civil unrest continuing to overpower conversations surrounding COVID-19.
5. Conclusion
Sentiment analysis is a powerful data science technique for gleaning texts’ emotional intent. But it’s not without flaws. For example, it cannot interpret things such as irony, sarcasm, and more importantly, the context and circumstances surrounding the events described in the text. The technology will have to evolve from analyzing text at just the word level to something more macro, such as sentence or paragraph, for better outcomes. Regardless, sentiment analysis remains vitally useful, especially for analyzing large sets of data such as the one employed in this experiment. Moreover, this blogpost also demonstrated the utility of generating word clouds that are segmented by their positive, neutral, and negative sentiment values. Finally, by combining the insights from both sentiment analysis and segmented word clouds, this experiment was able to make a series of meaningful observations in response to the question of understanding people’s sentiments during the first six months of the coronavirus pandemic.
